
District Profile
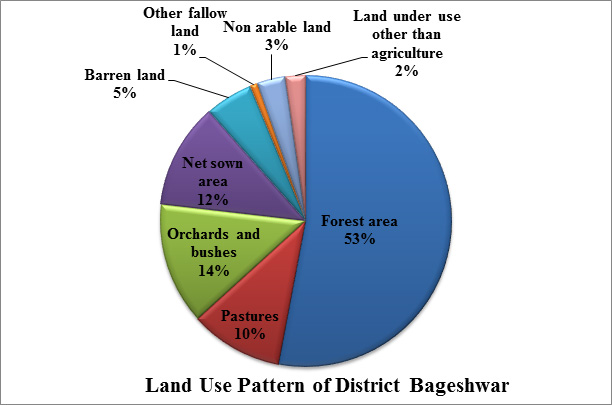
Land Utilization Pattern in Bageshwar District
| S.N. | ||
|---|---|---|
| 1 | Total Geographical Area | 2246 Km2 |
| 2 | Total Population (2011) | 259900 |
| 3 | Net Sown Area | 20754 ha |
| 4 | Net Irrigated Area | 4414 ha |
| 5 | Area under Horticultural Crops | 28819 ha |
| 6 | Area under Forest | 110160 ha |
| 7 | Cultivable Barren Land | 11889 ha |
| 8 | Barren and uncultivable land | 6694 ha |
| 9 | Permanent Pastures | 20738 ha |
| 10 | Annual Rainfall (Average) | 1286 mm |
| 11 | Total Livestock Population (2019) | 243826 |
| 12 | Other Fallow Land | 2114 ha |
Source: District Statistical Diary of Bageshwar District (2023)
Land Use Pattern of District Bageshwar
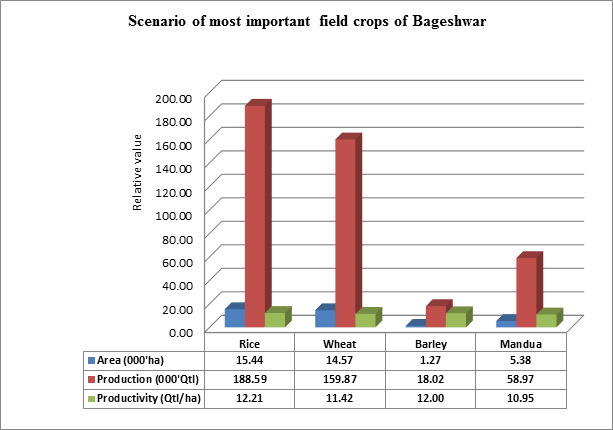
6.5 Area and Production of Major Field Crops in Bageshwar District
The population of Livestock, Poultry, Fisheries, etc. in the District
The total livestock population in Bageshwar is 2,43,826 in which cattle 147044, Buffalo 31432, Goat is 102075, sheep 20800, Pig 114, Horse/Mule 1961 and others (Yak/Dog/rabbit) 11262, and poultry 17986. The total production of milk per annum is 55.17 Th MT, Meat is 01 Lakh kg, an egg is 18.6 Lakhs and wool is 31.2 Th kg. The per capita availability of milk in Uttarakhand is 387g/day/person while the meat is 2kg/person/year and egg is 27egg/person/year (as per livestock census 2019).
Major Farming Systems/Enterprises (Based on the Analysis Made by the KVK)
| S.N. | Farming system/enterprise |
|---|---|
| 1 | Agriculture+Animal Husbandry |
| 2 | Agriculture+Horticulture |
| 3 | Agriculture+Horticulture+Animal Husbandry |
Description of Agro-climatic Zone & Major Agro-Ecological Situations (Based on Soil and Topography)
| S.N. | Farming System/Enterprise | Farming System/Enterprise |
|---|---|---|
| 1 | Western Himalayan region |
Soil Type:
| S.N. | Soil Type | Characteristics | Area in ha |
|---|---|---|---|
| 1 | Sandy loam | Shallow & moderately Shallow, 4.5-5.5 pH+ | |
| 2 | Sandy loam | Deep & Shallow, 5.5 – 6.5 pH+ | |
| 3 | Sandy loam | Rock out crops & glacier, > 6.5 pH+ |
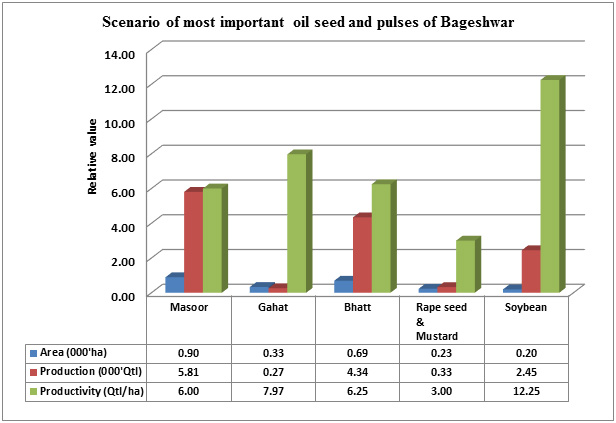
Area, Production, and Productivity of Major Crops Cultivated in the District
| S.N. | Crop | Area (ha) | Production (Qtl) | Productivity (Qtl /ha) |
|---|---|---|---|---|
| Field Crops Including Oil Seed & Pulses | ||||
| 1 | Rice | 15439 | 188590 | 12.21 |
| 2 | Wheat | 14,570 | 11.42 | |
| 3 | Barley | 1,270 | 12.00 | |
| 4 | Maize | 384 | 3650 | 9.5 |
| 5 | Mandua | 5382 | 58970 | 10.95 |
| 6 | Madira | 466 | 4630 | 9.93 |
| 7 | Urad | 69 | 490 | 7.10 |
| 8 | Masoor | 895 | 6.00 | |
| 9 | Field pea | 8 | ||
| 10 | Gahat | 333 | 265 | 7.97 |
| 11 | Rajmash | 12 | 8 | 6.50 |
| 12 | Bhatt | 694 | 4340 | 6.25 |
| 13 | Rape Seed & Mustard | 230 | 3.00 | |
| 14 | Seasmum | 11 | 2 | 2.2 |
| 15 | Groundnut | 0 | 0 | 0 |
| 16 | Soybean | 200 | 2450 | 12.25 |
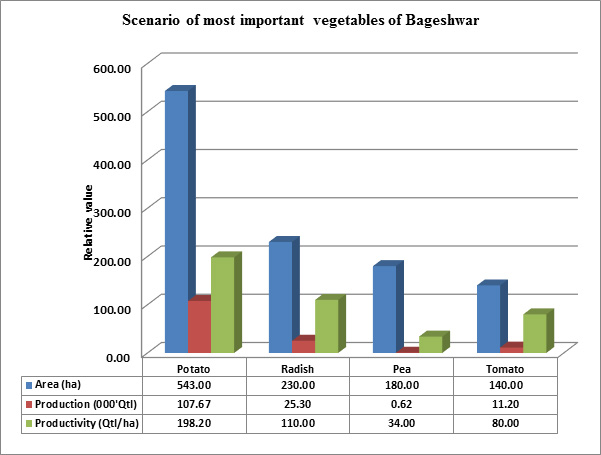
| Vegetables | ||||
| 1 | Pea | 180 | 615 | 34.0 |
| 2 | Radish | 230 | 2,5300 | 110.0 |
| 3 | French Bean | 54 | 3800 | 70.3 |
| 4 | Tomato | 140 | 1,1200 | 80.0 |
| 5 | Brinjal | 41 | 5850 | 136.0 |
| 6 | Capsicum | 38 | 1900 | 50.0 |
| 7 | Okra | 30 | 2100 | 70.0 |
| 8 | Onion | 86 | 9460 | 110.0 |
| 9 | Cabbage | 60 | 6950 | 115.8 |
| 10 | Cauliflower | 30 | 2900 | 96.6 |
| 11 | Potato | 543 | 107,670 | 198.2 |
Weather Data:
| Month | Rainfall (mm) | Temperature 0 C | Relative Humidity (%) |
|---|---|---|---|
| Average Annual | 1286 | Maximum: 35.0 Minimum: -3.2 |
60-64 |
Production and Productivity of Livestock, Poultry, Fisheries, etc. in the District
| Category | Population | Production | Productivity |
|---|---|---|---|
| Cattle | |||
| Crossbred | 76181 | ||
| Indigenous | 70863 | ||
| Buffalo | 31432 | ||
| Sheep | |||
| Crossbred | 3724 | ||
| Indigenous | 17076 | ||
| Goat | 102075 | ||
| Pigs | 114 | ||
| Crossbred | 0 | ||
| Indigenous | 114 | ||
| Rabbits | 97 | ||
| Poultry | 17986 | ||
| Hens | 7567 | ||
| Desi | 7236 | ||
| Improved | 3159 | ||
| Ducks | 24 | ||
| Turkey and Others | 0 | ||
| Category | Area | ||
| Fish | 8 Lakh fingerlings distributed | ||
| Marine | |||
| Inland | |||
| Prawn | |||
| Scampi | |||
| Shrimp | |||